Your numbers, clear at a glance.
We turn reports, survey results and long copy into infographics people read and remember.
Get a quote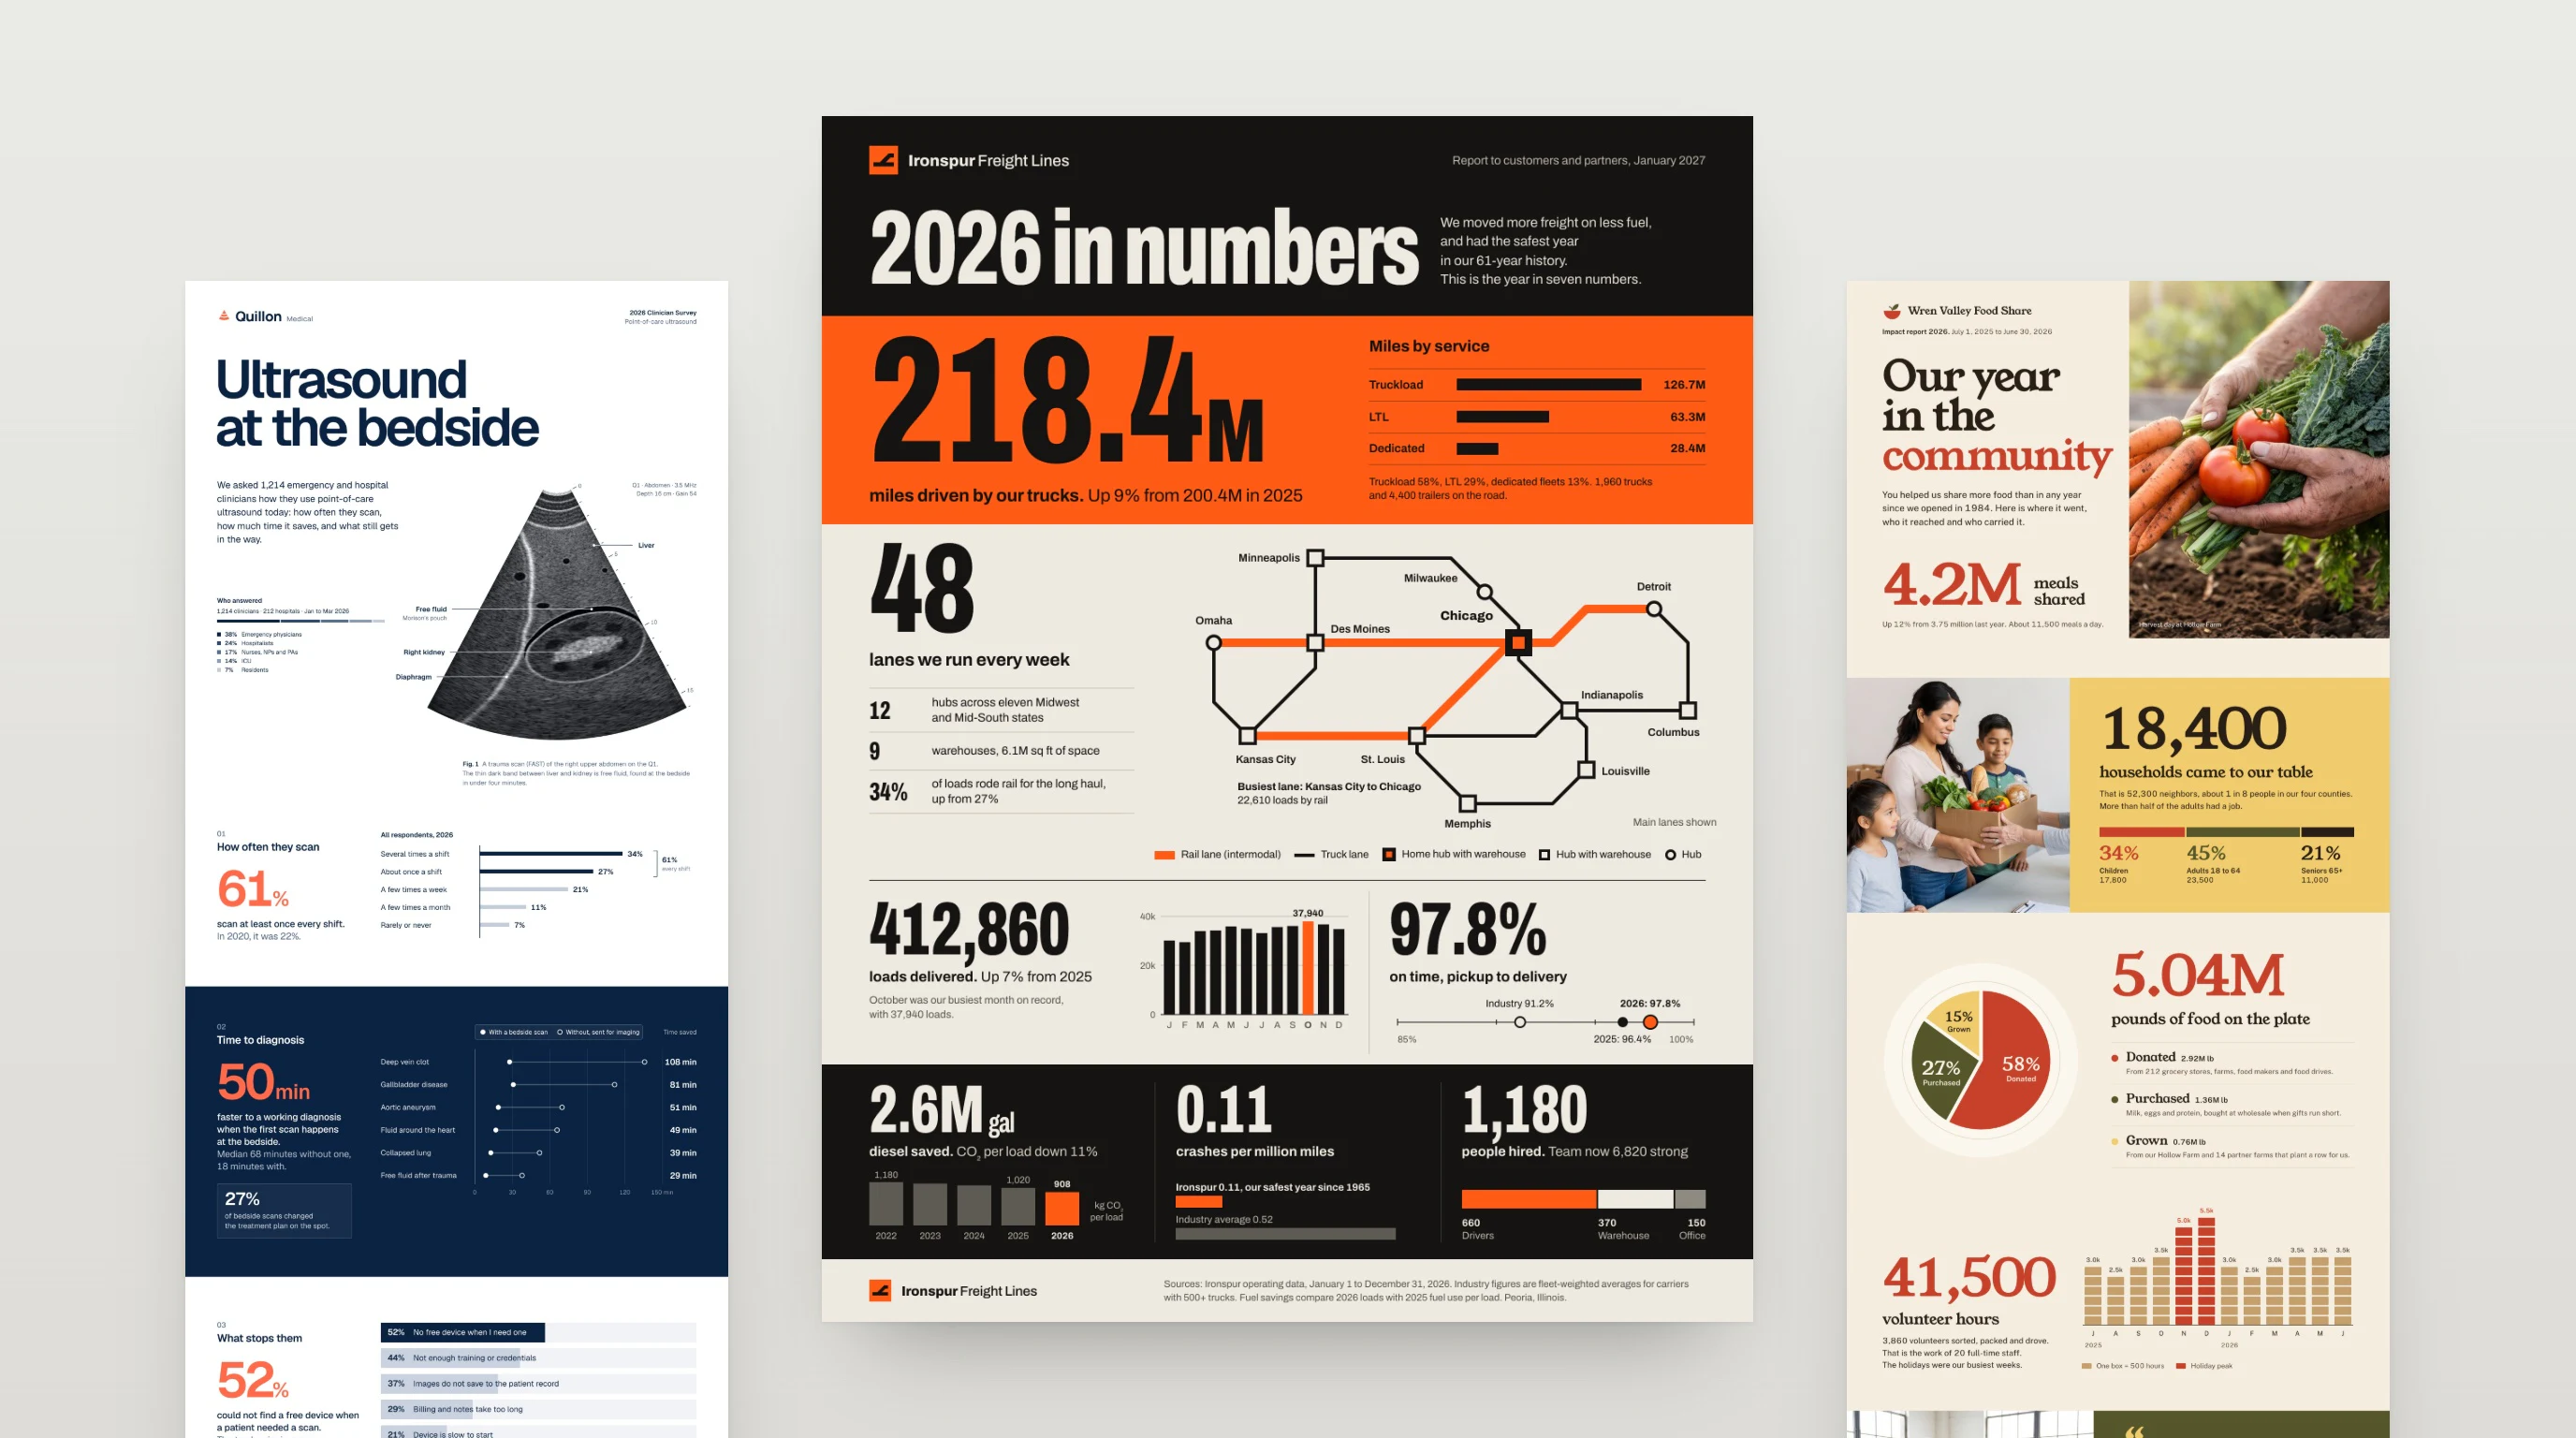
Less to read, more to remember.
Details from infographics we designed.
The key number
comes firstYour key number leads. The detail backs it up.
Charts drawn
from your dataRebuilt from your numbers, with every source kept.
Your facts,
untouchedWe design, we don’t rewrite. Your team checks every figure.


How it works
You work with two designers. No account managers.
01. Send your content
Your report, data or draft copy. Add your brand files if you have them.

02. Review the draft
We design the full piece and send it to you. Two rounds of changes are included.
03. Get every size
A print PDF, a web image, LinkedIn sizes and a slide for your deck.

Six infographics, six different looks.
FloQast is client work. The other five are samples for made‑up companies.


Quillon Medical
Medical devices · Clinician survey, long infographic
Ironspur Freight Lines
Freight and logistics · Year in numbers, one Letter page
Brannock Hill Asset Management
Wealth management · Market outlook, long infographic
Wren Valley Food Share
Nonprofit · Annual impact report, long infographic
Sable Ridge Power & Gas
Energy utility · Bill explainer, one Letter page
FloQast
Accounting software · Survey report, long infographic
Pick the size of your infographic.
One page
One Letter page. Up to 5 sections.
$385 for 5 sections
Ready in 3 business days
Long
A tall web page or two Letter pages. Up to 10 sections.
$575 for 10 sections
Ready in 5 business days
A section is one heading with its chart, number or short list.
- Two rounds of changes
- A slide for your deck
- A print PDF
- A web image
- LinkedIn sizes
- Your brand colors and fonts
- The editable source file
- Sources and footnotes kept
“Ben took a complex workflow and turned it into an easy‑to‑read graphic that accompanied a column our consultant wrote. He was able to turn this around quickly and did an awesome job.”
Questions about infographics
$385 for one page, $575 for a long piece. We confirm your price within one business day. It changes only if the work changes.
Your report, spreadsheet or draft copy, and your brand files if you have them. A few notes and the numbers are enough to start.
No. Your figures, claims and sources stay as you wrote them. If a section is too long to read at a glance, we suggest a shorter version and you decide.
Yes. We build every chart from your numbers, so it is exact. Send the spreadsheet, not a screenshot of the chart.
Tell us the date when you send your content. If we can make it, the quote says so and shows every date.
A print-ready PDF, a web image, the LinkedIn sizes you need and a slide for your deck, plus the editable source file. You keep every file.
Yes. We design one piece, then set it for each place: a tall image for your site, a Letter PDF, a slide for your deck and posts cut from it for LinkedIn.
Two rounds are included. You review the full piece and tell us what to change.
Yes. We use your colors, fonts and icon style. If you do not have a style for charts yet, we make one you can use again.
One fixed price for your infographic.
Tell us what you have and when you need it. You get one price within one business day.
Trusted by teams at