

How much does infographic design cost in 2026?
Real 2026 prices for infographic design: templates, fixed-price services, freelancers, contests, subscriptions and agencies, with worked examples.

A custom infographic costs anywhere from about $49 to $5,000 or more in 2026. At the low end, an online service turns a short list of numbers into a graphic in a day. At the high end, an agency researches the topic, writes the story, draws every illustration and promotes the finished piece for you. A template tool costs less than both, about $10 to $25 a month, but then the design work is yours to do.
We design infographics for B2B companies, nonprofits and marketing teams, so we wanted an answer we could stand behind. On November 6, 2026, we checked the published prices of every kind of option we could find: template tools, fixed-price infographic services, freelance marketplaces, design contests, design subscriptions, agencies and in-house salaries. When a price comes from a company’s own pricing page, we link to that page. When it comes from someone else’s estimate, we say so and name who made it.
The range is wide because “an infographic” can mean very different jobs. A one-page graphic with five numbers and a bar chart is a small job. A tall survey report with ten sections, charts rebuilt from a spreadsheet and a custom drawing is a big one. This guide shows what drives the price, what each kind of help costs and how to compare quotes that look alike but are not.
The short answer
| Option | What you pay | One infographic |
|---|---|---|
| Do it yourselfTemplate tools: Canva, Venngage, Visme | $10–$25 a month per personbilled yearly | A month of the tool, plus your time |
| Online serviceFixed packages by number of data points | $49–$299 a piece24 to 72 hours | $49–$299 |
| MarketplaceFiverr gigs and 99designs contests | Fiverr: design gigs from $599designs: $599–$2,499 a contest | By tier on Fiverr, $599–$2,499 for a contest |
| FreelancerUpwork or independent designer | $15–$150 an houracross Upwork and Contra | $250–$1,000 on Upwork, up to $5,000 for complex work |
| SubscriptionUnlimited design requests | $559–$1,199 a monthcommon plans that include infographics | One month of the plan |
| AgencyContent or infographic agency | $3,000–$7,250 a piecepublished agency rates, one from 2022 | $3,000–$7,250 |
| XioboOur infographic design | $385 one page, $575 longtwo rounds of changes included | $385 or $575 |
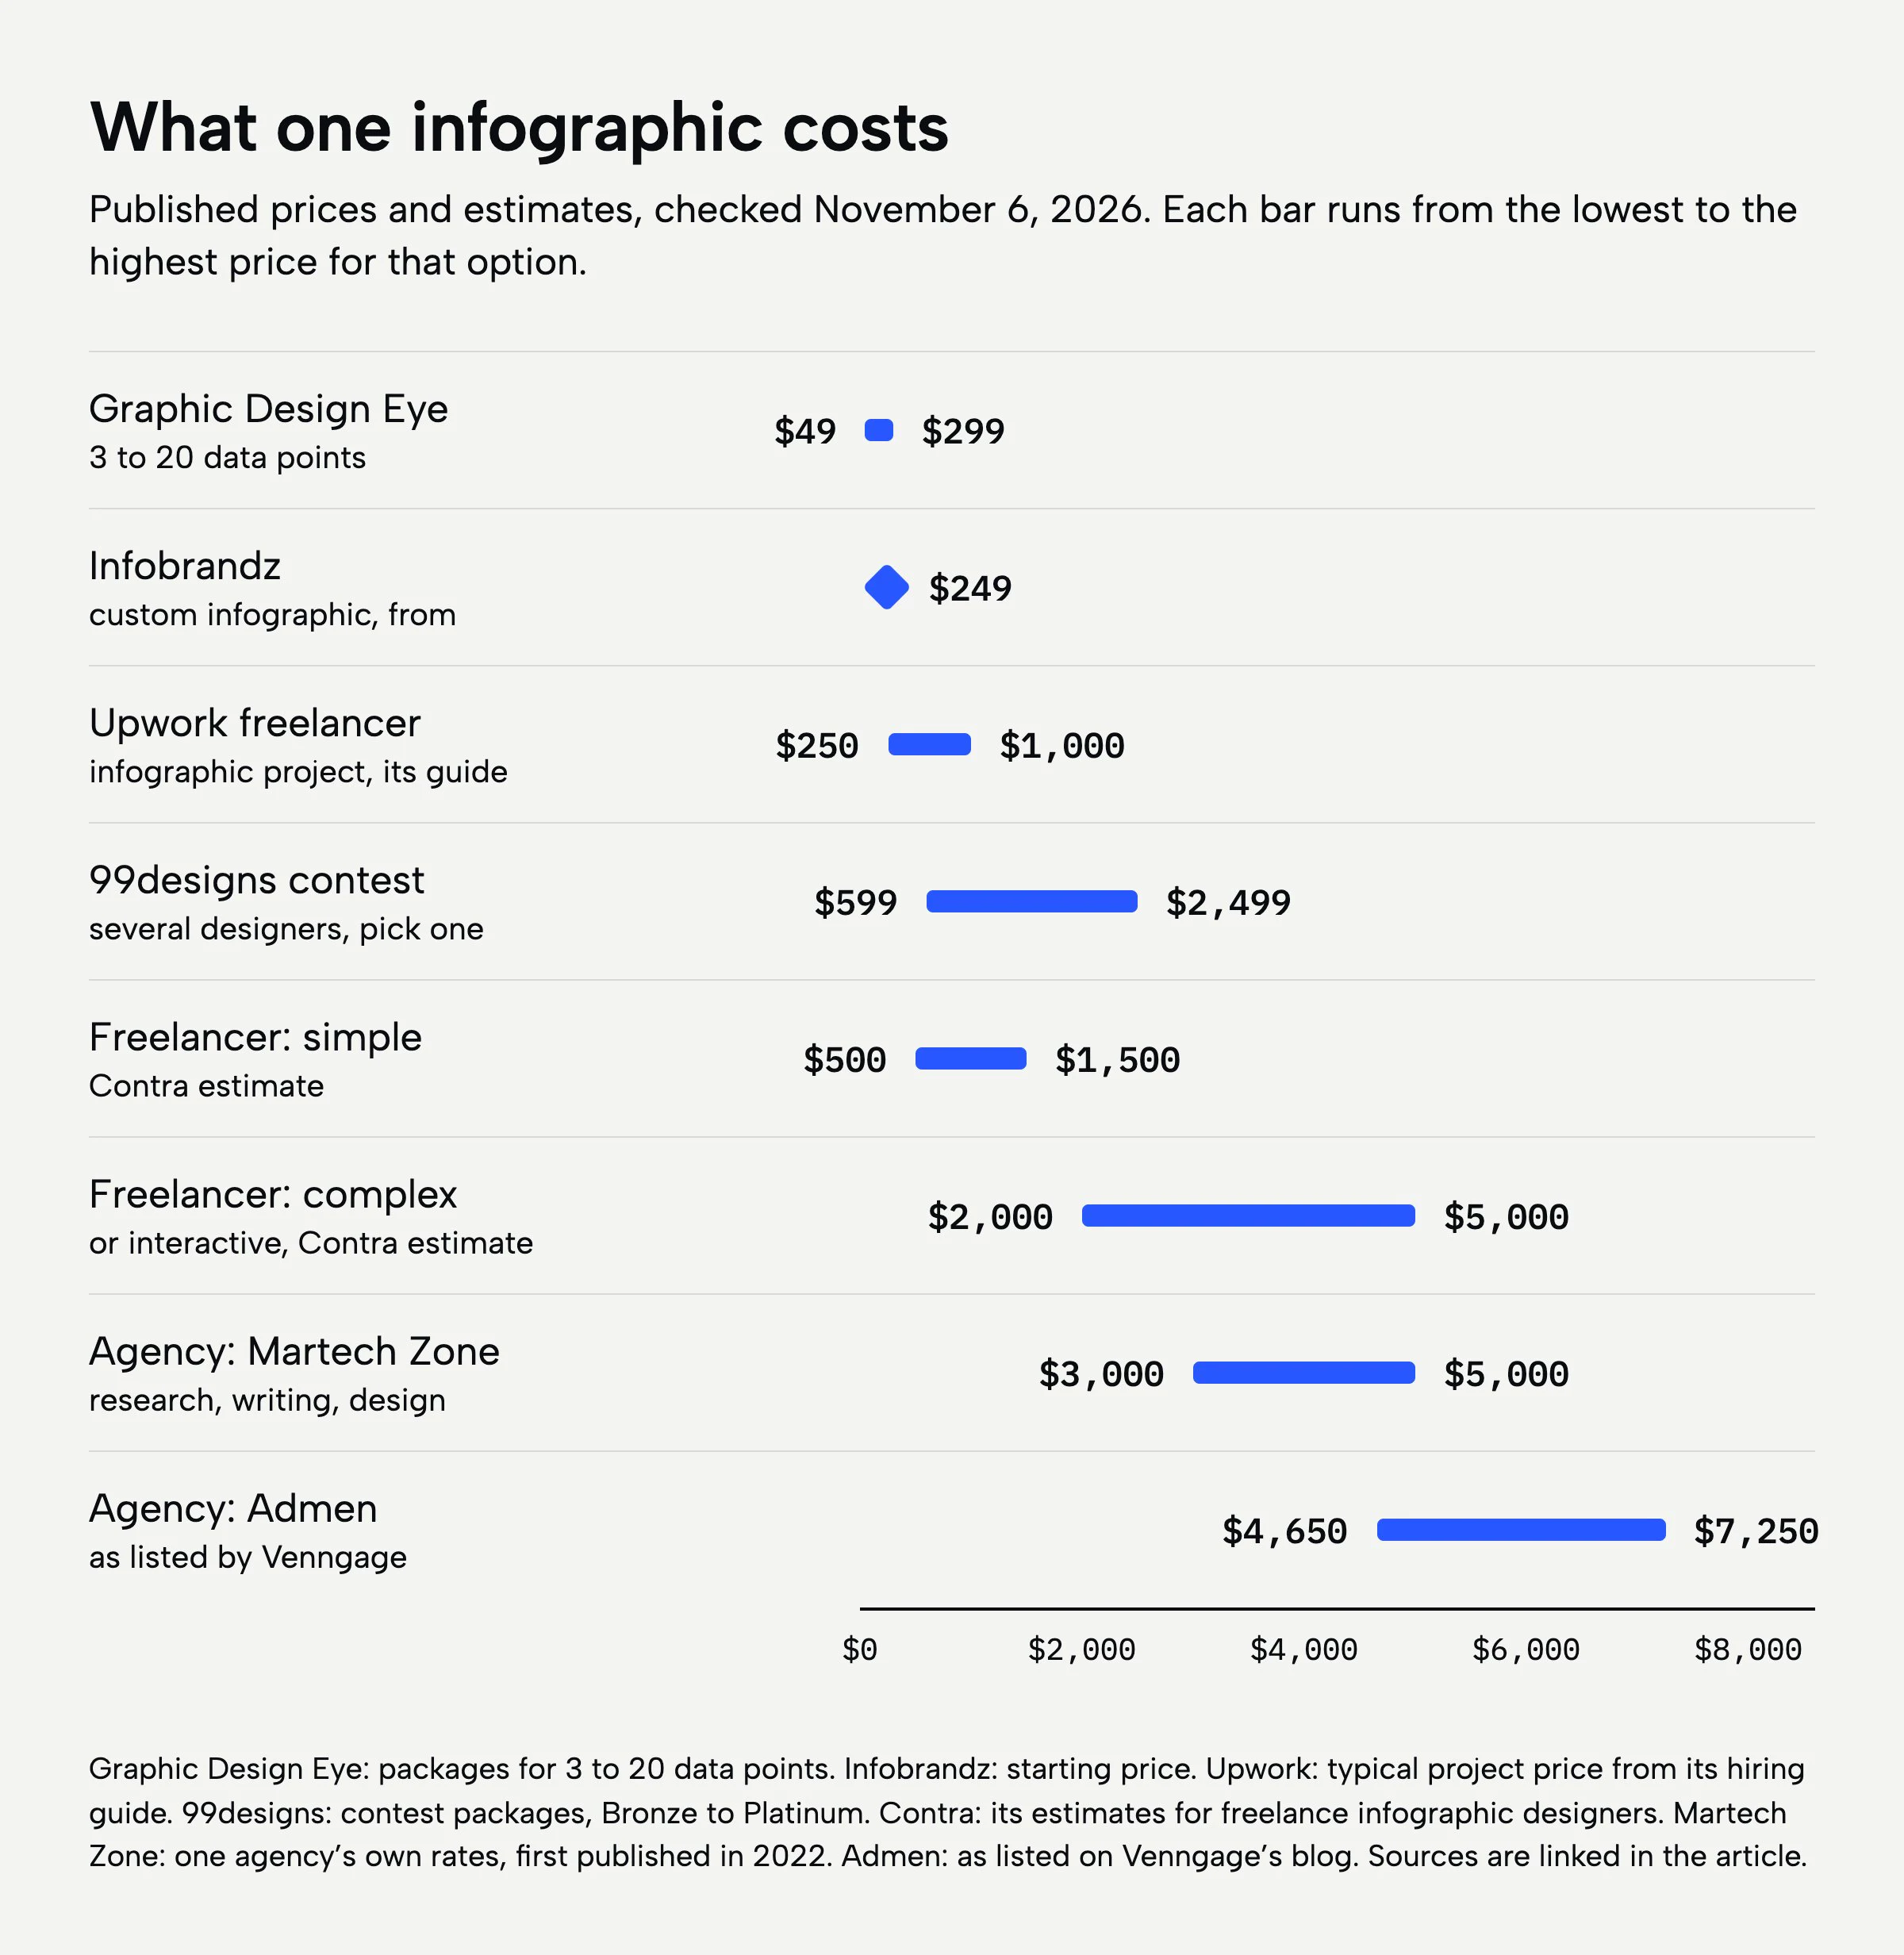
You will find the source for each figure in the sections below. The short version: a price for “an infographic” means little until you know how many sections it has and how ready your content is.
What decides the price of an infographic
An infographic looks like one picture, but it is many small design decisions stacked on one page. Most of the price is a designer’s time, so the useful question is how long those decisions take. Four things decide that more than anything else.
The size of the piece. Designers count size in different ways. Some services count data points: Graphic Design Eye, an online infographic service, charges $49 for up to 3 data points and $299 for up to 20. Others count sections, or simply quote one page versus a long, scrolling piece. We count sections, and the example below shows what we mean.
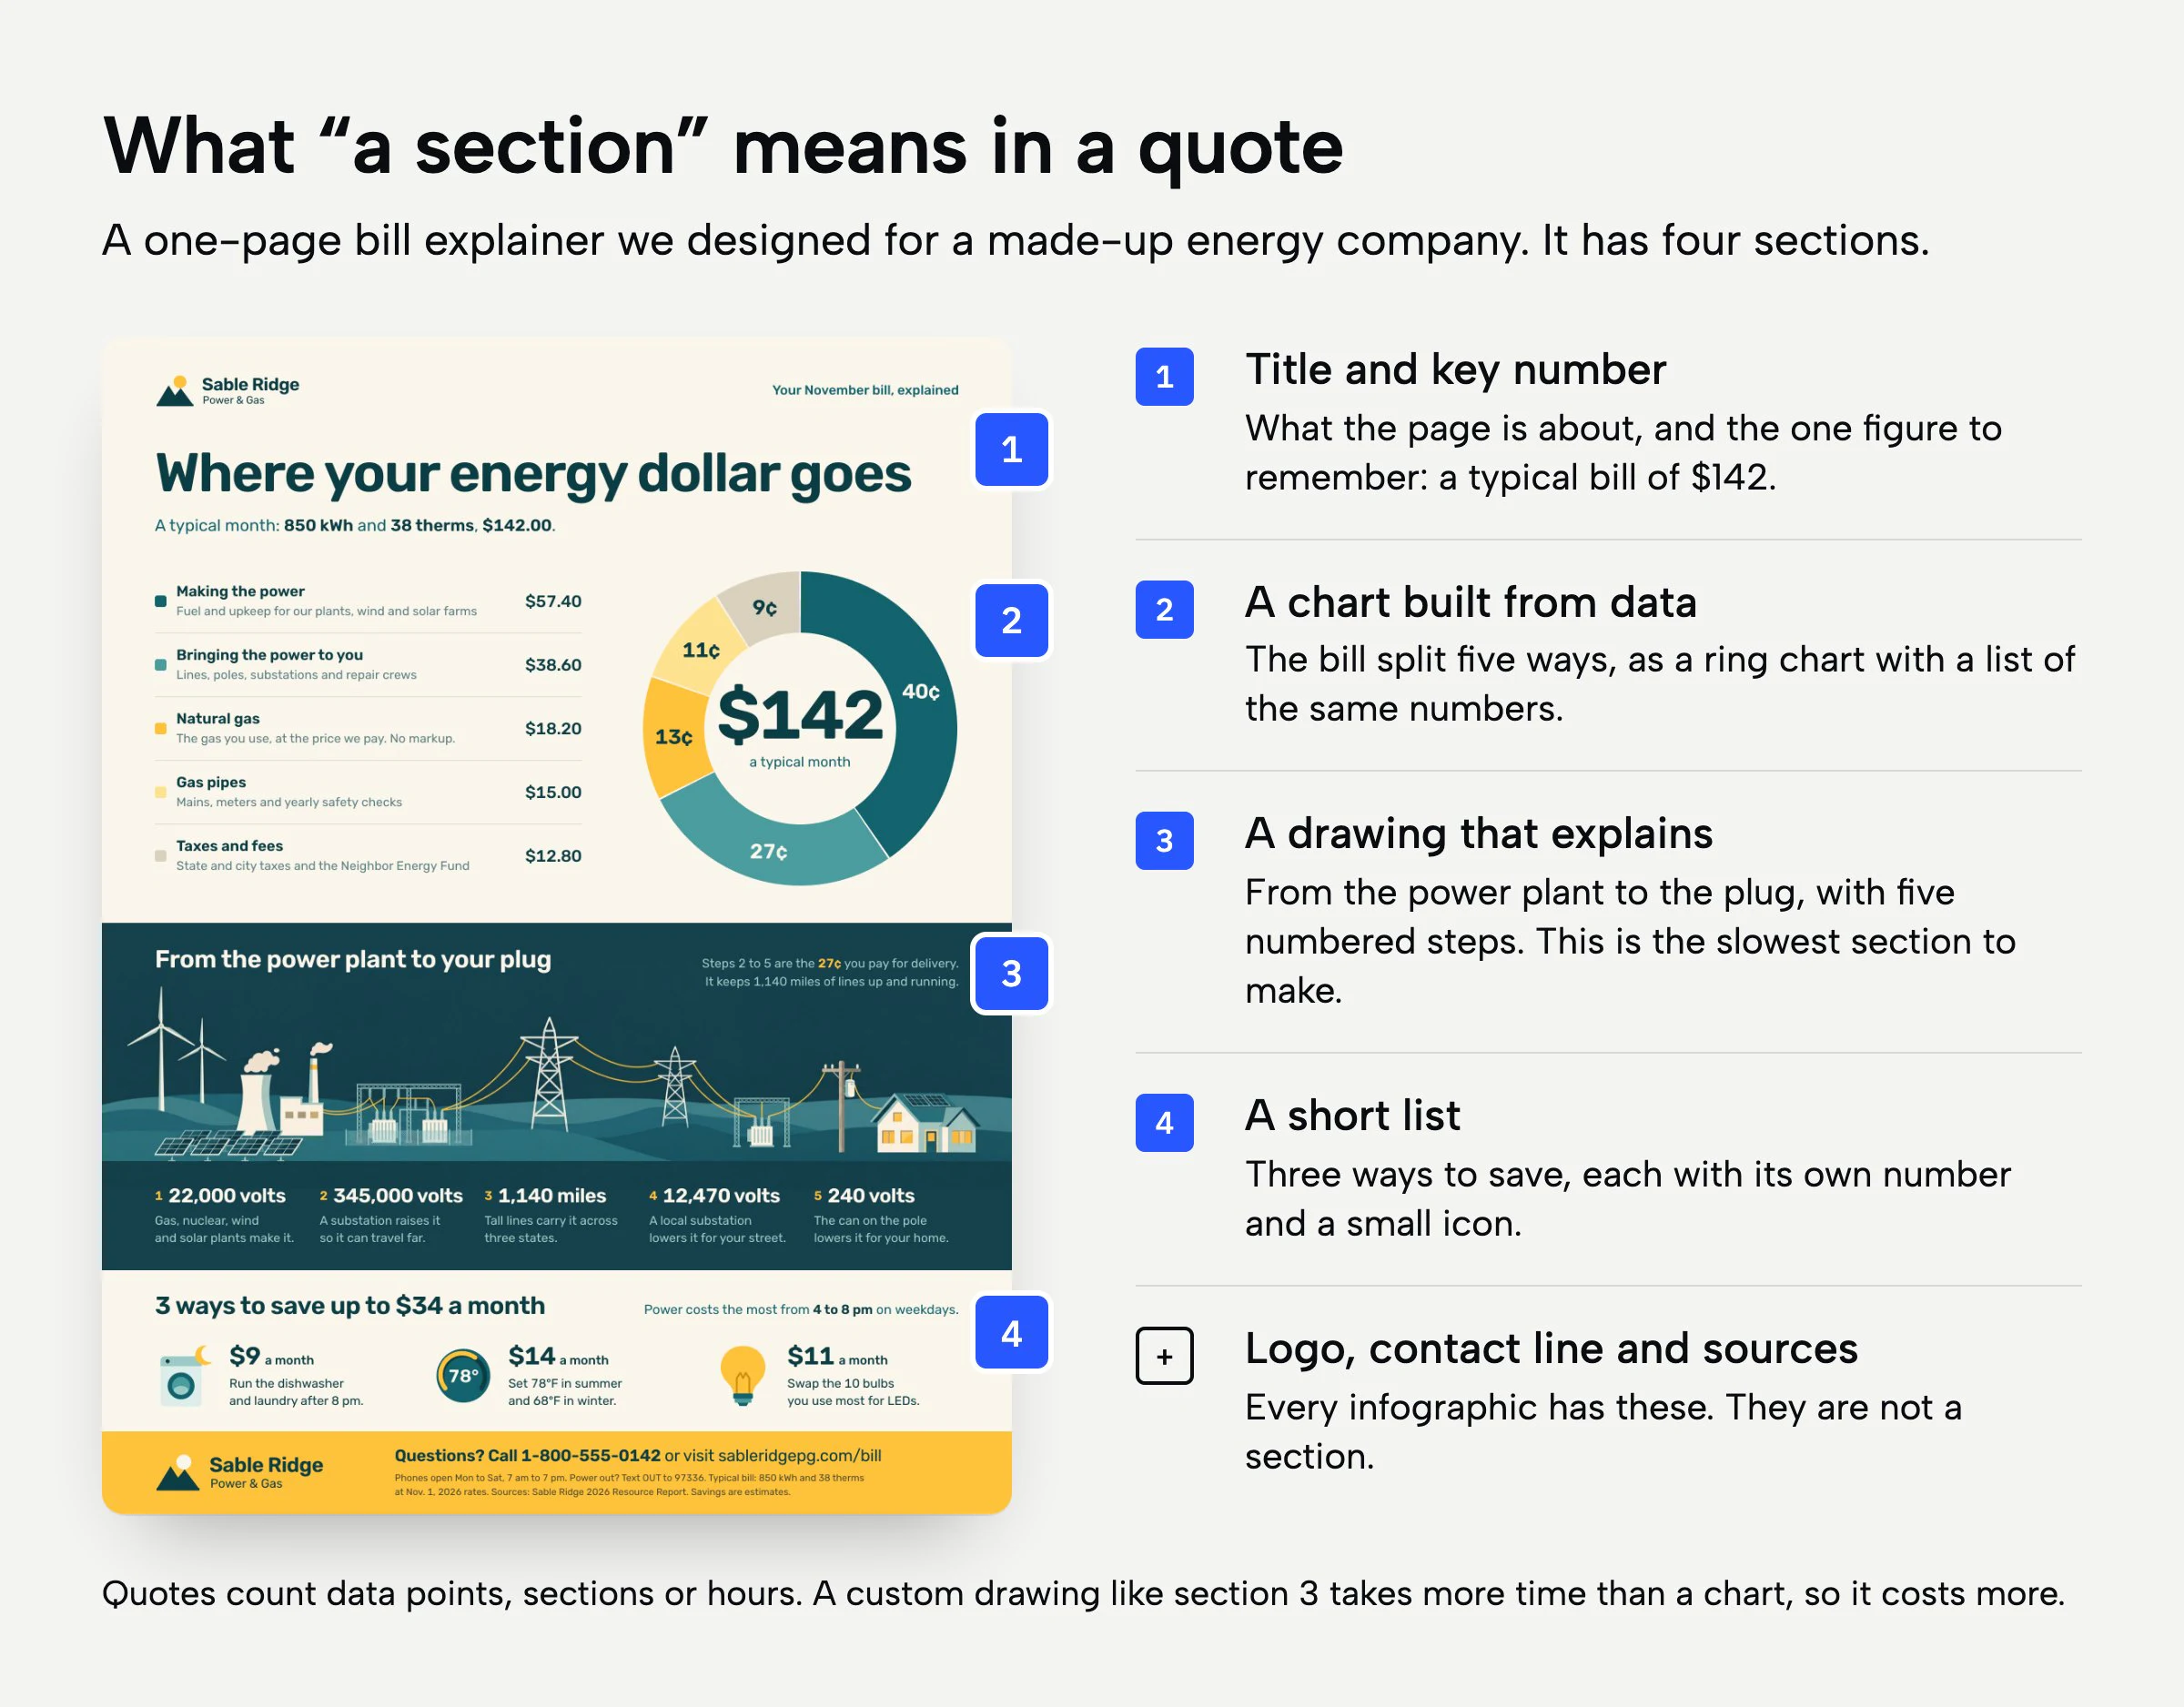
How ready your content is. This is the biggest cost driver, and you control it. A designer who gets final numbers, approved wording and the source for every figure can spend every hour on design. A designer who gets a 40-page report and the words “pull out the interesting parts” must first read, choose and write. That is real work, and it is often the most valuable work, but it is writing and editing, not layout. Some agencies include it in the price, and that is part of why their prices start in the thousands. Most low-cost services do not include it at all.
Charts from real data. A chart that only needs your brand colors is fast. A chart rebuilt from your spreadsheet, so every bar is the exact size of its number, takes longer, and it is the only kind of chart you should publish. A designer who traces a screenshot of an old chart can get a value wrong without noticing. Ask for the spreadsheet route, and expect to pay for it.
Custom drawings. Icons from a stock set are cheap. Noun Project, for example, sells unlimited icon downloads for $3.33 a month, billed yearly. A drawing made only for your piece, like the power plant scene in section 3 above, can take as long as all the other sections together. If your infographic needs one, it is often worth it: it is the part people remember and share. But it should be a clear line in the quote, not a surprise.
A few smaller things also change the price. Rounds of changes: most quotes include one to three rounds, and some services promise unlimited ones. Sizes and formats: one design set up as a print PDF, a tall web image, a slide and a few social posts is more work than one PNG. Stock photos: Adobe Stock starts at $29.99 a month for up to 10 images. Source files: ask whether you get the editable file, so your team can update the numbers next year without paying for a new design.
Doing it yourself with template tools
Template tools are the cheapest way to get an infographic that looks finished. Here is what the main ones cost, from their own pricing pages on November 6, 2026, unless we say otherwise:
| Tool | Published price | Worth knowing |
|---|---|---|
| Venngage | Premium: $10 a month, billed yearlyBusiness: $24 a month per user, billed yearly | PDF export and brand kits are on Business |
| Visme | Starter: $147 a yearBusiness: $297 a year per person | Brand kit and PowerPoint export are on Business |
| Infogram | Pro: $19 a monthbilled yearly | Your own logo and brand kit are on the $67 Business plan |
| Adobe Express | Premium: $9.99 a monthbilled monthly | Brand kits and Adobe Stock content included |
| Canva | Pro: $144 a yearfor one person | Business is $250 a year per person |
Sources: Venngage, Visme, Infogram, Adobe Express and Canva.
These tools are good at one thing: a fast layout. Pick a template, replace the text, change the colors, and in an hour you have something that looks like an infographic. For an internal update or a quick social post, that may be all you need.
For a piece that carries your brand to customers, investors or the press, the limits matter. A template sets the structure before you know what your data says, so the content gets cut to fit the boxes. Thousands of other companies start from the same templates. And the hardest part is still yours: deciding the one number that matters, writing short lines that a reader understands at a glance, and checking that every chart is drawn to scale.
So the real price of this route is your team’s time. The median pay for US advertising, promotions and marketing managers is $79.70 an hour, according to the Bureau of Labor Statistics. If one infographic takes that person a full working day of eight hours, that is about $638 of their time, before you count the work they didn’t do instead. That is more than many professional designers charge for the same piece.
Hiring help: services, marketplaces, freelancers and agencies
Fixed-price infographic services are the cheapest way to hire a designer. You send your numbers, pick a package and get the file back in one to three days. Graphic Design Eye publishes four packages: $49 for up to 3 data points with 24-hour delivery, $99 for up to 8, $199 for up to 15 and $299 for up to 20 with 72-hour delivery, all with editable files. Infobrandz lists a custom infographic from $249. This route works when your content is final and short. It works less well when you need help deciding what to show, because a package priced by data points assumes you already did that part.
Marketplaces cover the widest range. Fiverr says its graphic design gigs start at $5. Most sellers offer three tiers that add more data points, more revisions and faster delivery, and the price you see first is for the smallest one, so read what each tier includes before you compare. 99designs runs design contests instead: you post a brief, several designers send concepts and you pay for the one you pick. Its infographic contests cost $599, $899, $1,599 or $2,499, and the higher packages bring more designers and more support. A contest gives you choices, but each designer works from your brief alone, so a clear brief matters more here than anywhere.
Freelancers charge by the hour or by the project. Upwork’s own hiring guide says graphic designers on its platform generally charge $15 to $35 an hour, and up to $60 to $120 for complex work, fast deadlines or more experience. It puts an infographic or data visualization project at $250 to $1,000. Contra, another freelance marketplace, estimates $25 to $45 an hour for entry-level infographic designers and $85 to $150 or more for senior ones. It puts simple infographics at $500 to $1,500 and complex or interactive ones at $2,000 to $5,000 or more. Those are a marketplace’s estimates, not quotes, and they are higher than the fixed packages above because they usually include more of the thinking. The way to choose is to look at infographics a freelancer made from messy data, not only their three best pieces. Ask what the client sent them. A clear piece made from a finished brief proves less than a clear piece made from a 40-page report.
Design subscriptions charge a flat monthly fee for a stream of design requests, and most include infographics. ManyPixels starts at $559 a month on a yearly plan, Delesign at $899 a month, with a $1,199 plan above it, and Penji at $995 a month. This model suits a team that needs new graphics every week, for social posts, ads and one-pagers as well as infographics. For one important infographic, you pay for a month of capacity you may not use, and you may not get the same designer next time.
Agencies sit at the top. Many, like Lemonly, do not publish prices and quote after a call. One agency that does, Martech Zone, charges $5,000 for a single infographic, $4,000 each on a quarterly plan and $3,000 each on a monthly plan. Its price includes research, writing and design, and it says promotion to publishers can double the cost. That page was first published in 2022, so treat it as a guide, not a current quote. Venngage’s own blog lists another agency, Admen, at $4,650 to $7,250 per infographic. With an agency, you pay for the thinking as much as the drawing: the research, the angle and the plan to get the piece seen.
An in-house designer makes sense when your team needs infographics, reports and graphics every week. The US median salary for a graphic designer is $62,960 a year, or $30.27 an hour (May 2025 data). That is salary only. Benefits, software, fonts, stock and management time come on top, and not every graphic designer is good with data. Ask to see charts, not only logos and ads.
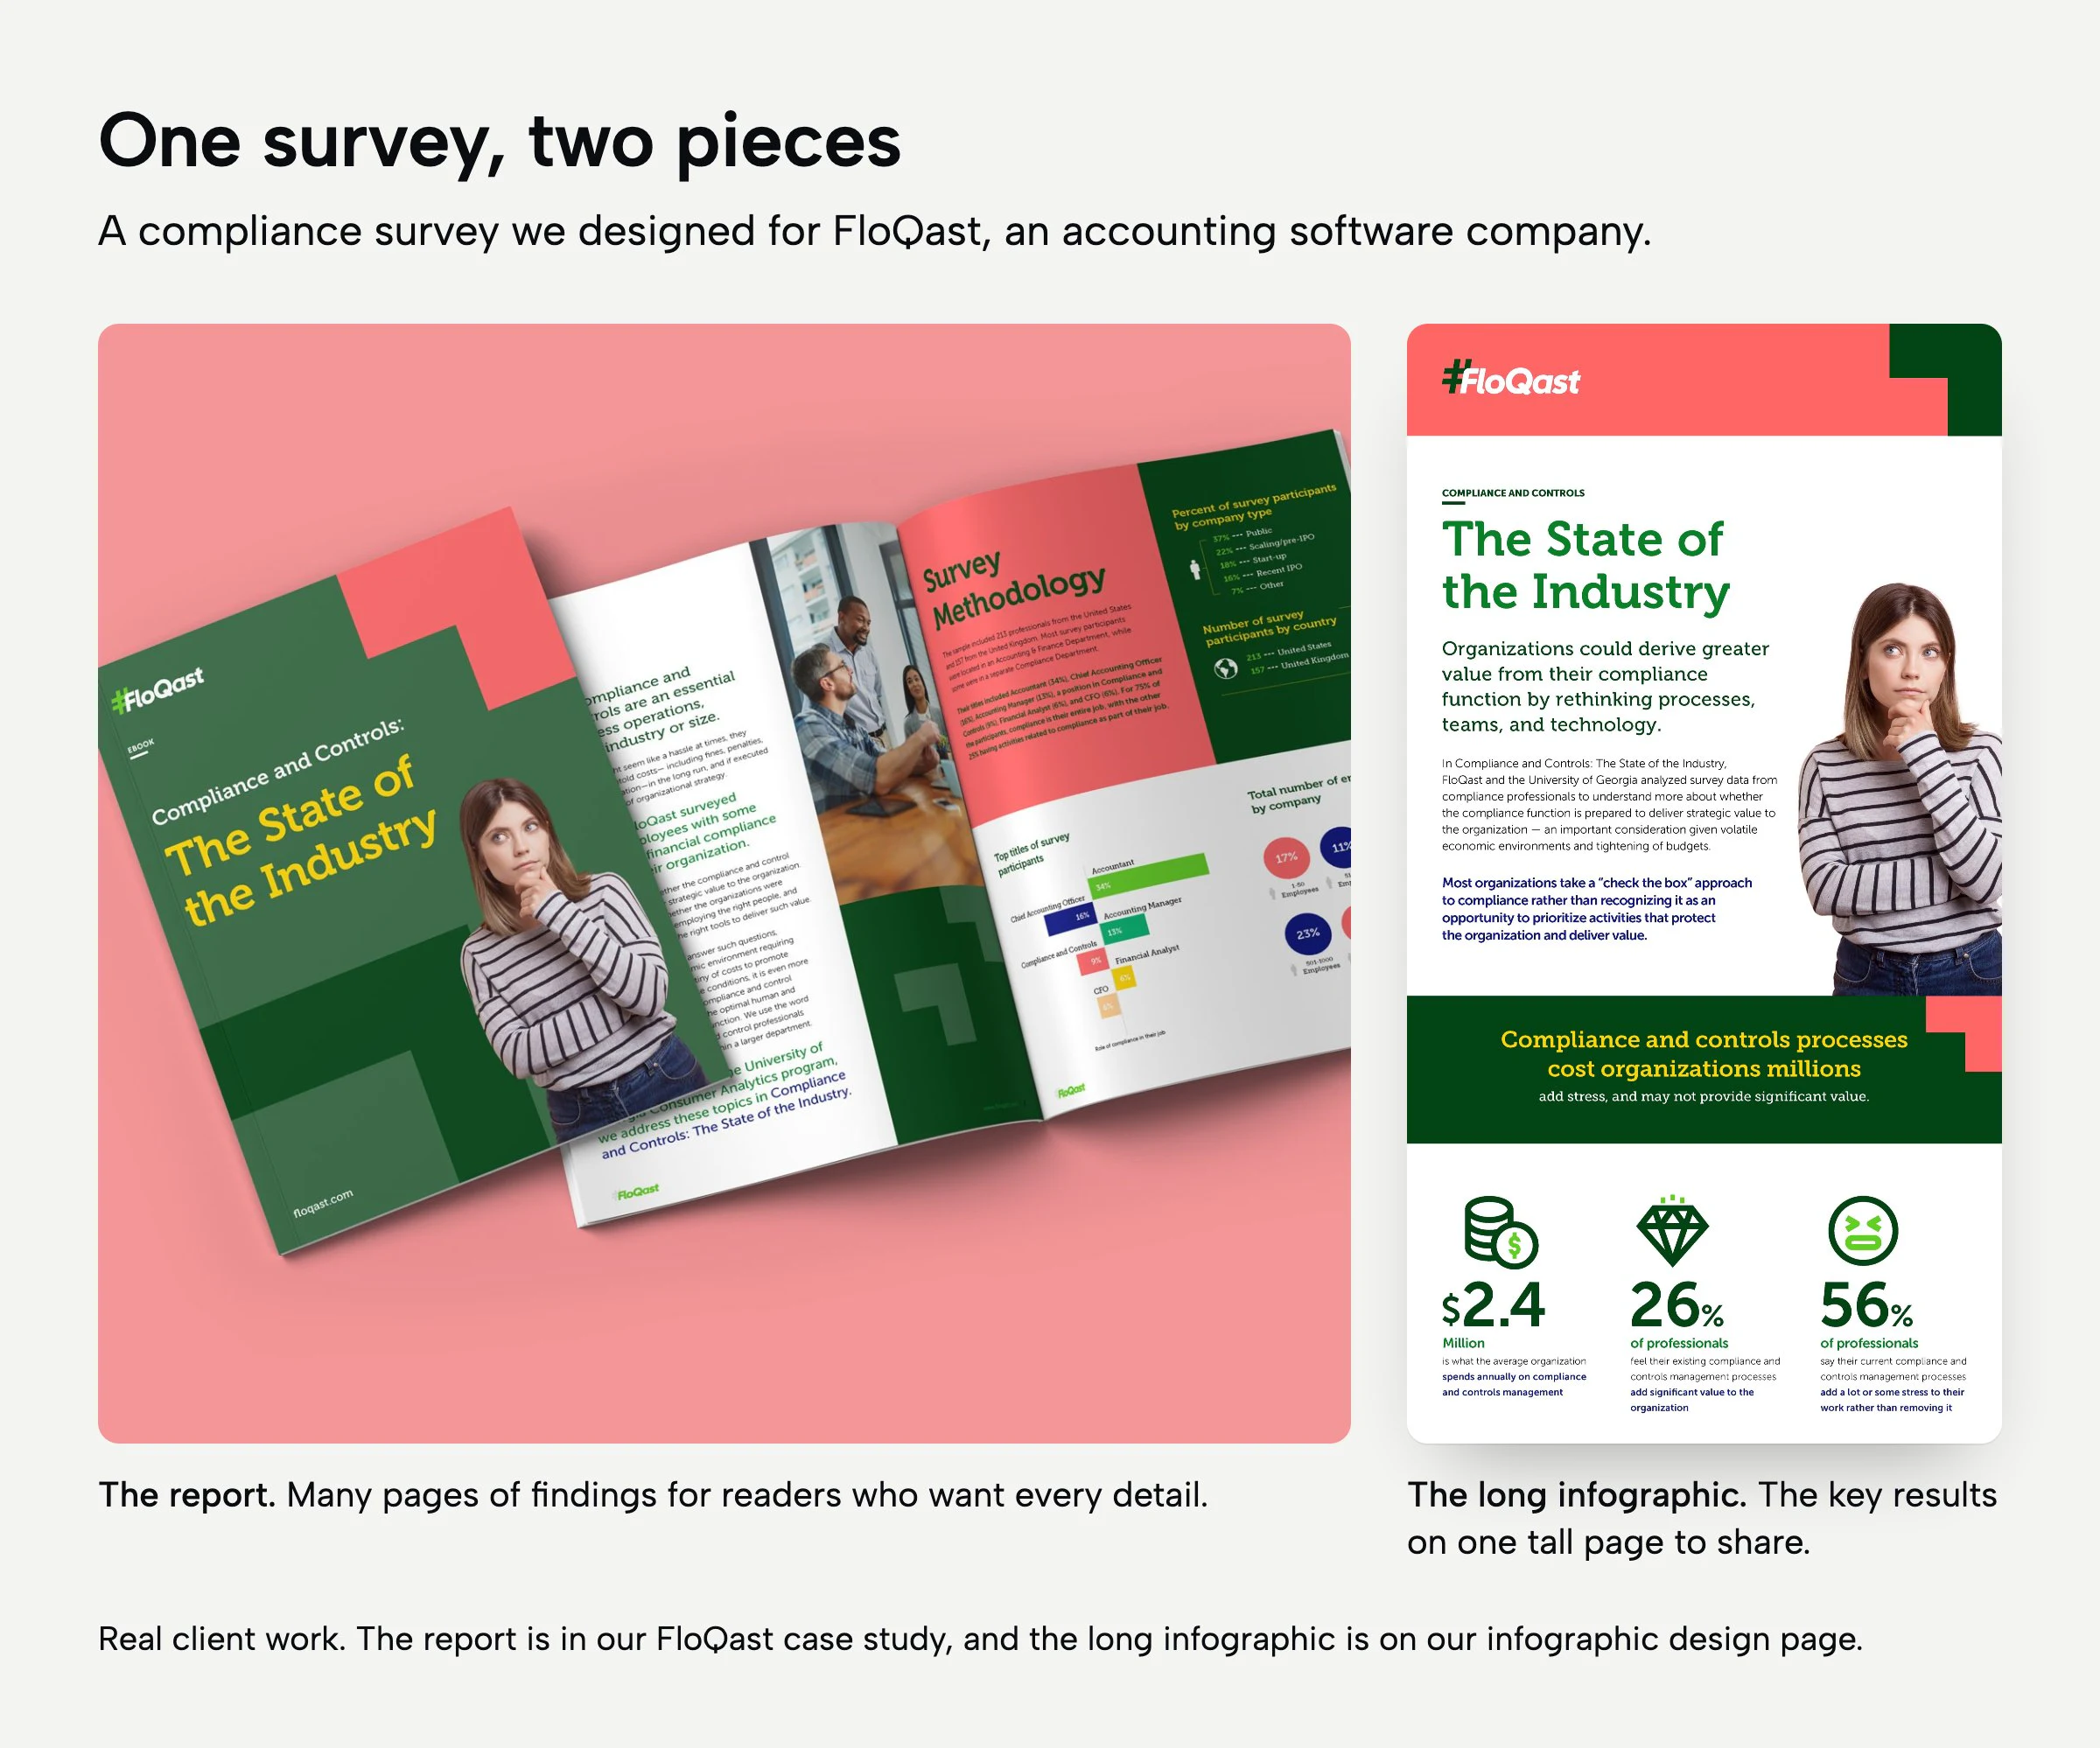
The FloQast work above shows why a long infographic is worth more than its page count. We designed both pieces from the same survey. The report holds every finding. The long infographic puts the key results on one tall page that people can read in a minute and share. The design work was mostly choosing: which three numbers lead, which results become charts and which stay in the report. You can see the full long infographic on our infographic design page, and more of that client work in our FloQast case study.
Three infographics, priced out
A range only helps once you see it on a real job. Here are three common ones, priced with the published numbers above. These are not quotes from any company. They show how the math changes when the job changes. Where we give design hours, they are our own estimates from years of this work.
A “year in numbers” page, content ready. A company has its eight key numbers for the year, approved, with the source for each one. It wants one page for LinkedIn and a print PDF. At Graphic Design Eye, 8 data points is the $99 package, with 24-hour delivery. A freelancer who needs about 6 to 10 hours, at $40 to $85 an hour, costs $240 to $850. A 99designs Bronze contest is $599 and gives several concepts to choose from. The cheap end works here because the hard decisions are already made.
A survey report, as a long infographic. A marketing team has results from a survey of 500 customers in a spreadsheet, plus a 30-page draft report. It wants a long infographic with about ten sections, four charts built from the data and one custom illustration. This job needs someone to choose and shorten, not only to lay out. A freelancer at 15 to 25 hours and $40 to $150 an hour costs $600 to $3,750. Contra’s estimate for complex pieces is $2,000 to $5,000. An agency that also writes and promotes it, at Martech Zone’s single-piece rate, is $5,000.
One infographic a month for a year. A content team wants twelve infographics a year for its blog and social channels. At Martech Zone’s monthly rate of $3,000 each, that is 12 × $3,000 = $36,000. A ManyPixels subscription on its yearly plan is 12 × $559 = $6,708, and the same plan can also cover other design work. Doing it in house with Venngage Business costs only 12 × $24 = $288 a year for the tool. But if each piece takes eight hours of a marketing manager’s time at that $79.70, that is 12 × 8 × $79.70 = $7,651 of their time, or $7,939 with the tool.
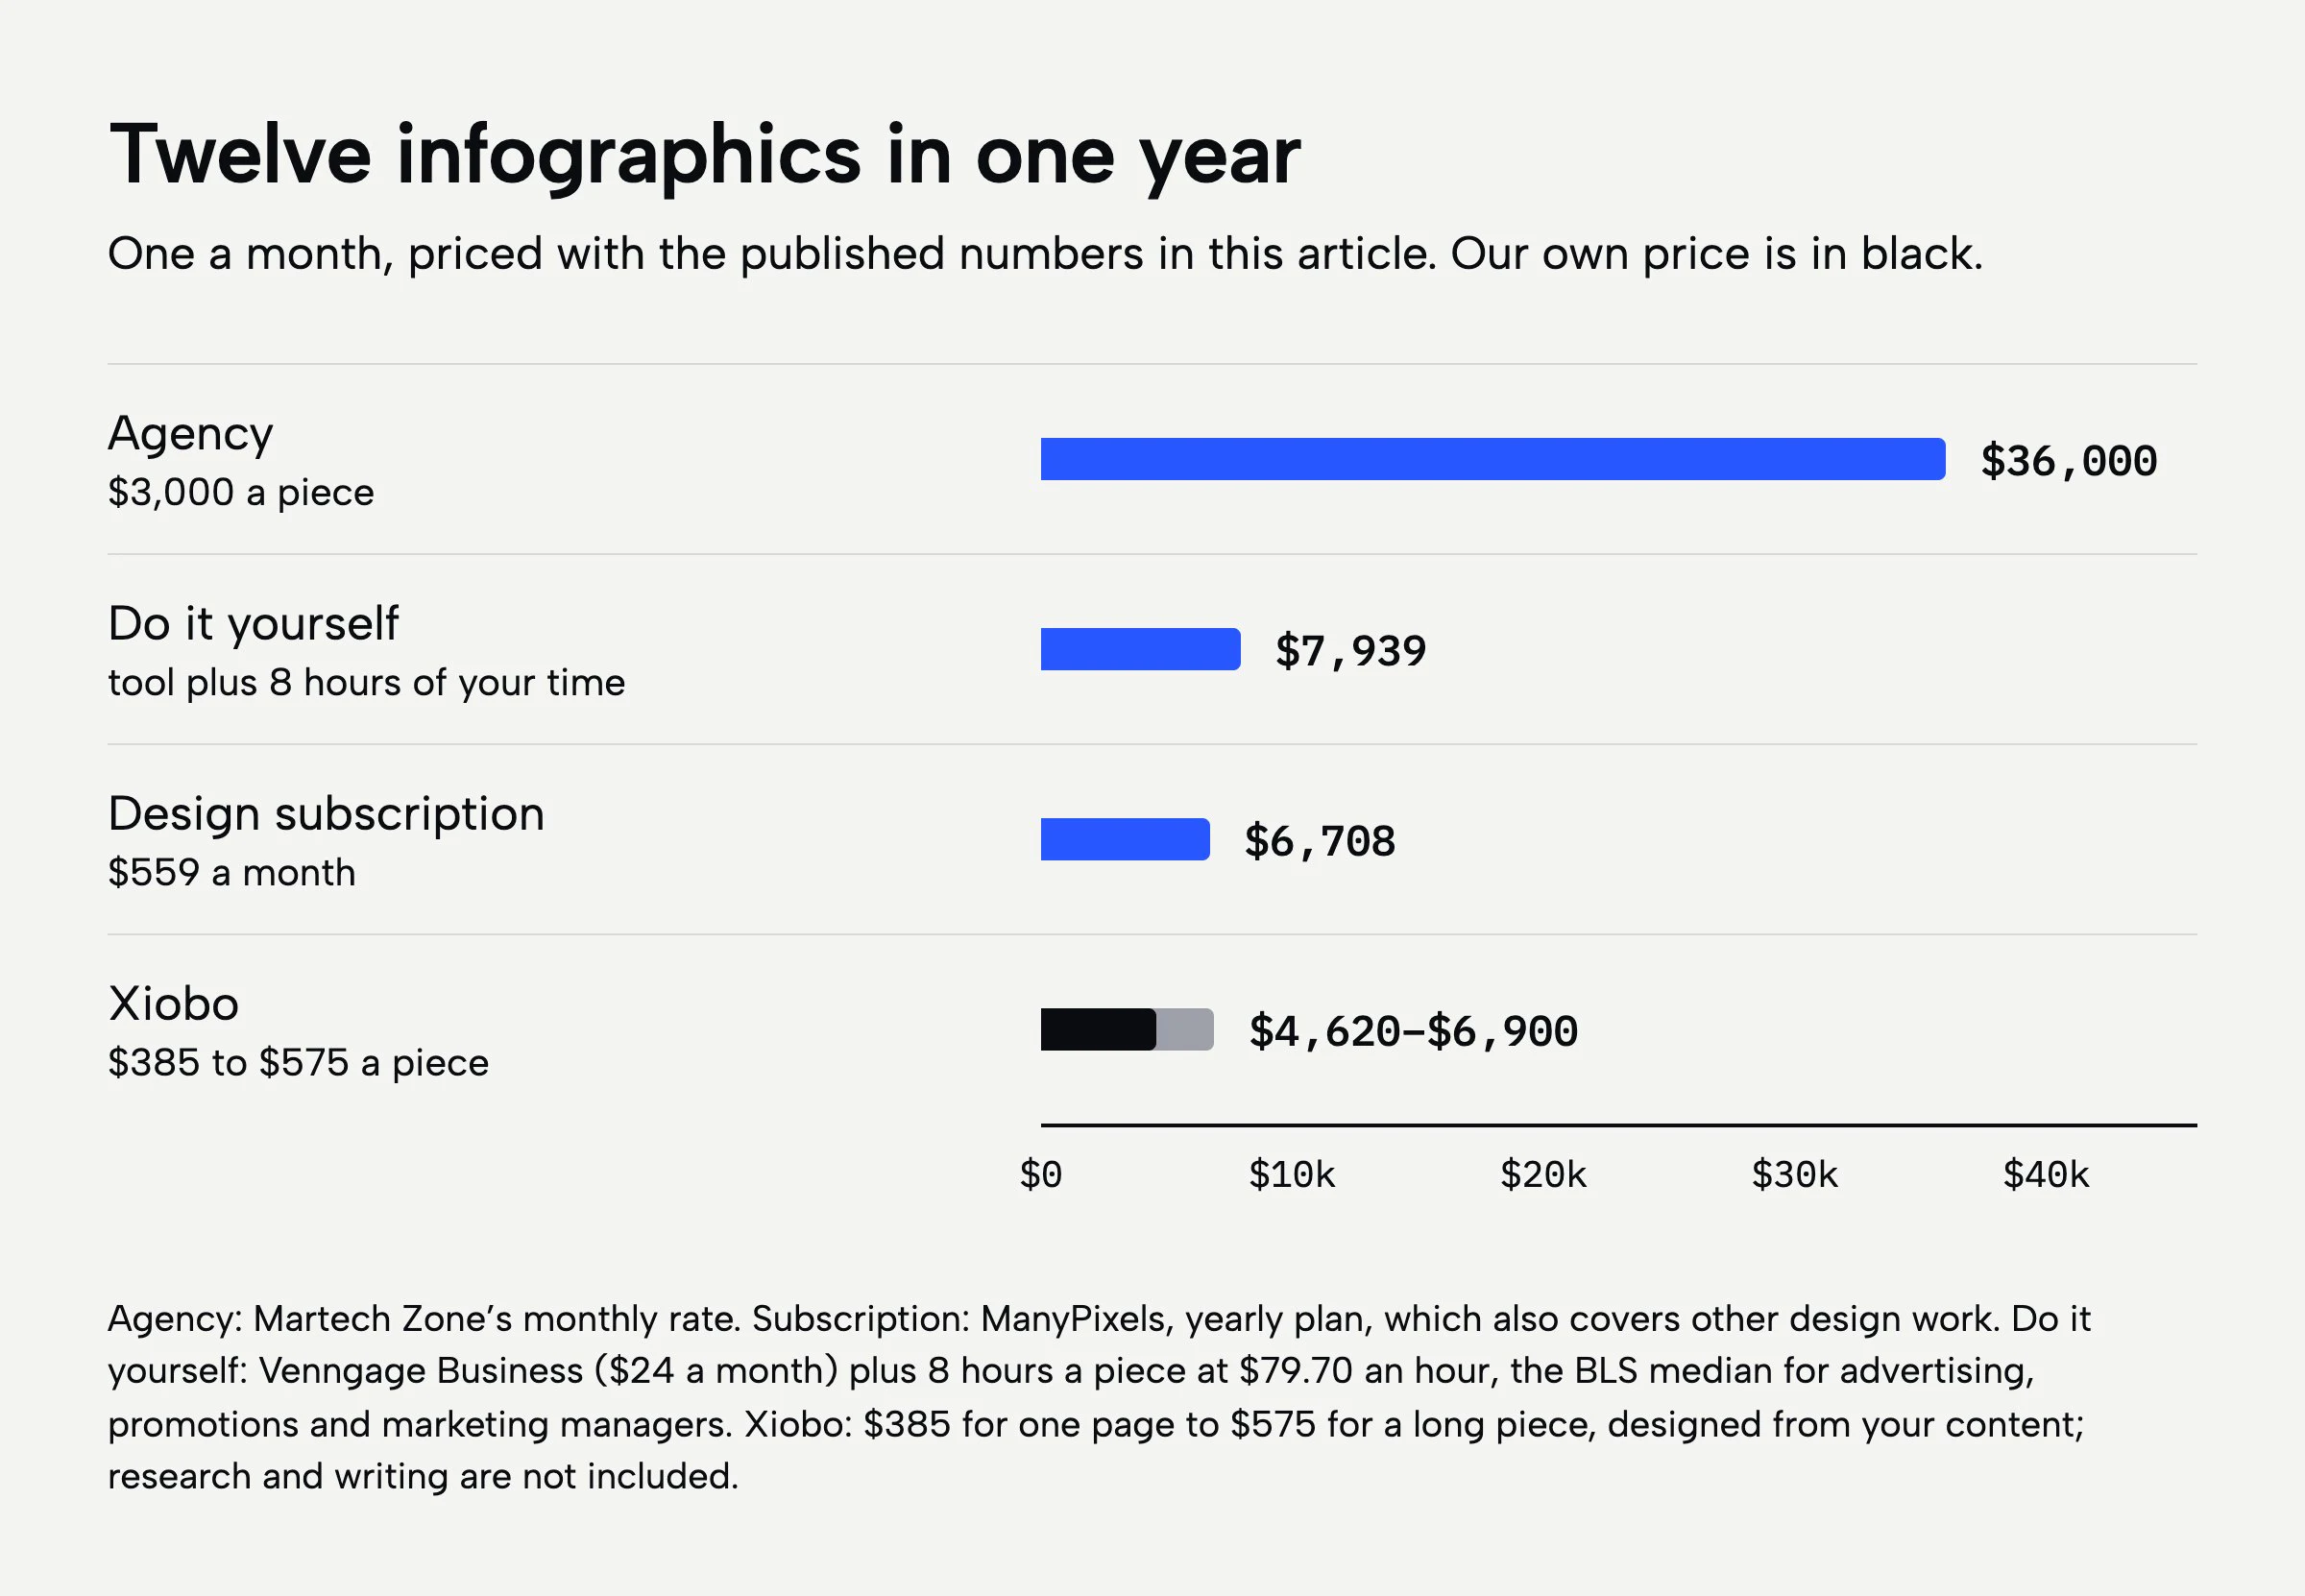
Across the three jobs, the number of sections matters, but how ready the content is matters more. If you want to spend less, decide your key numbers and get them approved before you hire anyone.
Is a designed infographic worth paying for?
It depends on what the infographic has to do, and we want to be honest about the evidence. You have probably read that people process images “60,000 times faster” than text, or that “65% of people are visual learners.” Neither claim holds up. Jon Schwabish of PolicyViz traced the 60,000 figure to an old 3M brochure with no research behind it. And researchers like Daniel Willingham of the University of Virginia say there is no good evidence for learning styles at all. We could not find a current, independent study that proves infographics bring more sales. If a designer quotes those numbers to sell you an infographic, ask for the source.
What is well documented is how people read. In Nielsen Norman Group’s classic study, 79% of test users always scanned a new web page instead of reading it word by word. Their later eye-tracking research found that people fall back on an F-shaped scanning pattern when a page gives them no strong visual cues. A good infographic is a page full of strong cues: a key number that leads, headings that tell the story on their own and charts that make a point at a glance.
That is the real value, and it is why design quality matters more than decoration. An infographic that a reader understands in a few seconds gets read, shared and quoted. One that looks busy gets skipped, however many icons it has. The work you pay for is mostly editing: choosing the one number that leads, cutting what does not support it and drawing every chart to scale. For the same reason, we wrote a separate guide on why clarity matters in biotech presentations. The rules carry over to any page full of data.
How to get a quote you can compare
Two quotes for “an infographic” can describe very different jobs. Before you compare prices, make sure you compare the same thing. Ask every designer these seven questions:
- What counts as the size? Data points, sections or pages? Get the number in writing.
- Who chooses and writes the words? Many prices cover design only. Writing and editing are often extra.
- Are charts built from my data? Send the spreadsheet, not screenshots, and ask that every chart is drawn to scale.
- Is a custom drawing included? Or only stock icons? Both are fine, if you know which one you get.
- How many rounds of changes are included? And what does the next round cost?
- Which files do I get? A print PDF, a web image, social sizes, a slide and the editable source file are all different jobs.
- Who does the work? The person you talked to, or someone you will never meet?
When you ask for quotes, send the same package to everyone: your numbers and their sources, any report or draft copy, your brand files, where the piece will appear and the date you need it. Then each designer prices the same real job, and the quotes line up.
Here is how we price it. A one-page infographic of up to five sections is $385, ready in three business days. A long infographic of up to ten sections, a tall web page or two Letter pages, is $575, ready in five. Both include two rounds of changes, your brand colors and fonts, charts built from your data with every source kept, a print PDF, a web image, LinkedIn sizes, a slide for your deck and the editable source file. We design from your content: your words and numbers stay as you wrote them, and if a section is too long to read at a glance, we suggest a shorter version for you to approve. You send your content and we confirm your price within one business day. It changes only if the work changes. You can see six of our infographics on our infographic design page.
Quick answers
How much does an infographic cost in 2026?
A custom static infographic costs about $49 to $5,000 or more. Fixed-price online services charge $49 to $299 for a short piece. Freelancers on Upwork usually charge $250 to $1,000 a project, and complex or interactive pieces can reach $2,000 to $5,000 or more, by Contra’s estimate. Agencies that also research, write and promote the piece charge about $3,000 to $7,250. Template tools cost about $10 to $25 a month, plus your own time.
How much do freelancers charge for an infographic?
Freelance infographic designers charge about $15 to $150 an hour across Upwork and Contra, depending on experience. Upwork’s own guide puts a typical infographic project at $250 to $1,000. A simple one-page infographic from final content takes a skilled designer about 6 to 10 hours in our experience. At $40 to $85 an hour, that is about $240 to $850. A long infographic with charts from a spreadsheet and a custom illustration takes longer and costs more.
How long does it take to design an infographic?
A short infographic from final content takes one to three days with a fixed-price service. A long infographic with about ten sections usually takes a week or more, including two rounds of changes. If someone must also research and write the content, add the time for that, and for your team to approve it.
Is it cheaper to make an infographic in Canva?
The tool is cheaper: Canva Pro costs $144 a year for one person. But the design time becomes your team’s time. At the median pay for US marketing managers and their peers, $79.70 an hour, one working day on an infographic costs about $638 of their time, which is more than many designers charge for a one-page piece.
How much does an animated infographic cost?
Animated infographics are priced like short videos. Advids, a video production company, estimates $1,500 to $2,500 a minute for animated icon and text visuals, with two to three weeks of work. Voice, music and script can cost extra. A static infographic is usually the better first step: you can animate it later.
What should an infographic quote include?
The number of sections or data points, who writes and edits the words, whether charts are built from your data, any custom drawings, the number of rounds of changes, the delivery date and the list of files you get. A good quote also says what makes the price change.


